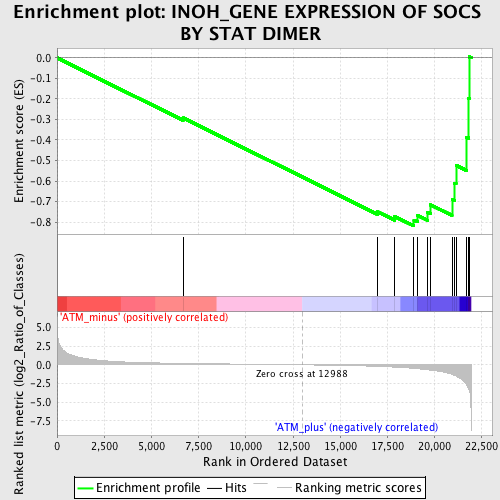
Profile of the Running ES Score & Positions of GeneSet Members on the Rank Ordered List
| Dataset | Set_02_ATM_minus_versus_ATM_plus.phenotype_ATM_minus_versus_ATM_plus.cls #ATM_minus_versus_ATM_plus.phenotype_ATM_minus_versus_ATM_plus.cls #ATM_minus_versus_ATM_plus_repos |
| Phenotype | phenotype_ATM_minus_versus_ATM_plus.cls#ATM_minus_versus_ATM_plus_repos |
| Upregulated in class | ATM_plus |
| GeneSet | INOH_GENE EXPRESSION OF SOCS BY STAT DIMER |
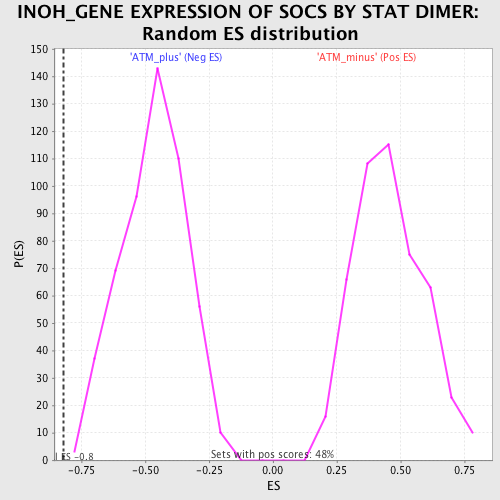
| Enrichment Score (ES) | -0.81906986 |
| Normalized Enrichment Score (NES) | -1.7551502 |
| Nominal p-value | 0.001908397 |
| FDR q-value | 0.082678944 |
| FWER p-Value | 0.522 |
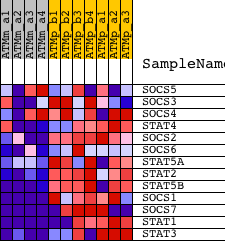
| PROBE | DESCRIPTION (from dataset) | GENE SYMBOL | GENE_TITLE | RANK IN GENE LIST | RANK METRIC SCORE | RUNNING ES | CORE ENRICHMENT | |
|---|---|---|---|---|---|---|---|---|
| 1 | SOCS5 | 1423349_at 1423350_at 1441640_at 1442890_at | 6670 | 0.194 | -0.2925 | No | ||
| 2 | SOCS3 | 1416576_at 1455899_x_at 1456212_x_at | 16975 | -0.204 | -0.7501 | No | ||
| 3 | SOCS4 | 1421273_at 1421274_at 1421275_s_at 1455142_at | 17878 | -0.306 | -0.7726 | No | ||
| 4 | STAT4 | 1448713_at | 18898 | -0.475 | -0.7902 | Yes | ||
| 5 | SOCS2 | 1418507_s_at 1438470_at 1441476_at 1442586_at 1446085_at 1449109_at | 19099 | -0.520 | -0.7677 | Yes | ||
| 6 | SOCS6 | 1435492_at 1450129_a_at 1452764_at 1459350_at | 19628 | -0.655 | -0.7519 | Yes | ||
| 7 | STAT5A | 1421469_a_at 1450259_a_at | 19785 | -0.702 | -0.7164 | Yes | ||
| 8 | STAT2 | 1421911_at 1450403_at | 20915 | -1.278 | -0.6902 | Yes | ||
| 9 | STAT5B | 1422102_a_at 1422103_a_at | 21046 | -1.408 | -0.6105 | Yes | ||
| 10 | SOCS1 | 1440047_at 1450446_a_at | 21129 | -1.501 | -0.5230 | Yes | ||
| 11 | SOCS7 | 1420766_at 1434834_at 1438492_at 1455402_at | 21684 | -2.669 | -0.3860 | Yes | ||
| 12 | STAT1 | 1420915_at 1440481_at 1450033_a_at 1450034_at | 21799 | -3.193 | -0.1971 | Yes | ||
| 13 | STAT3 | 1424272_at 1426587_a_at 1459961_a_at 1460700_at | 21823 | -3.342 | 0.0051 | Yes |